California's 1st congressional district
| California's 1st congressional district | |
|---|---|
 California's 1st congressional district - since January 3, 2013. | |
| U.S. Representative | Doug LaMalfa (R–Richvale) |
| Median income | $51,478[1] |
| Ethnicity |
|
| Cook PVI | R+11[3] |
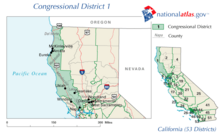
California's 1st congressional district is a congressional district in the U.S. state of California.
Doug LaMalfa, a Republican, has represented the district since January 2013.
Currently, the 1st district encompasses the northeastern part of the state. It consists of:[4]
- Butte County
- Lassen County
- Modoc County
- Plumas County
- Shasta County
- Sierra County
- Siskiyou County
- Tehama County
- most of Nevada County
- part of Glenn County
- part of Placer County
Prior to redistricting by the California Citizens Redistricting Commission of 2011, the 1st district encompassed the northern coast of the state. It consisted of Del Norte, Humboldt, Lake, Mendocino, and Napa counties plus portions of Sonoma and Yolo counties. Much of that area is now the 5th district, while the current 1st district comprises much of the territory that had been the 2nd district.
.mw-parser-output .toclimit-2 .toclevel-1 ul,.mw-parser-output .toclimit-3 .toclevel-2 ul,.mw-parser-output .toclimit-4 .toclevel-3 ul,.mw-parser-output .toclimit-5 .toclevel-4 ul,.mw-parser-output .toclimit-6 .toclevel-5 ul,.mw-parser-output .toclimit-7 .toclevel-6 uldisplay:none
Contents
1 Competitiveness
1.1 Election results from recent statewide races
2 List of members representing the district
3 Election results
3.1 1864
3.2 1866
3.3 1868
3.4 1870
3.5 1872
3.6 1874
3.7 1876
3.8 1878
3.9 1880
3.10 1882
3.11 1884
3.12 1886
3.13 1888
3.14 1890 Special & General
3.15 1892
3.16 1894
3.17 1896
3.18 1898
3.19 1900
3.20 1902
3.21 1904
3.22 1906 (Special)
3.23 1908
3.24 1910
3.25 1912
3.26 1914
3.27 1916
3.28 1918
3.29 1920
3.30 1922
3.31 1924
3.32 1926
3.33 1928
3.34 1930
3.35 1932
3.36 1934
3.37 1936
3.38 1938
3.39 1940
3.40 1942
3.41 1944
3.42 1946
3.43 1948
3.44 1950
3.45 1952
3.46 1954
3.47 1956
3.48 1958
3.49 1960
3.50 1962
3.51 1963 (Special)
3.52 1964
3.53 1966
3.54 1968
3.55 1970
3.56 1972
3.57 1974
3.58 1976
3.59 1978
3.60 1980
3.61 1982
3.62 1984
3.63 1986
3.64 1988
3.65 1990
3.66 1992
3.67 1994
3.68 1996
3.69 1998
3.70 2000
3.71 2002
3.72 2004
3.73 2006
3.74 2008
3.75 2010
3.76 2012
3.77 2014
3.78 2016
3.79 2018
4 Living former representatives
5 Historical district boundaries
6 See also
7 References
8 External links
Competitiveness
Prior to 2013, the GOP last held the seat in 1998 when U.S. Representative Frank Riggs decided to run for the U.S. Senate. Riggs was replaced by long-time Democratic Assemblyman and State Senator Mike Thompson. Redistricting in 2001 added Democratic-leaning areas of Yolo County.
John Kerry won the district in 2004 presidential election with 59.7% of the vote. Barack Obama carried the district in 2008 presidential election with 65.60% of the vote. The new 1st district is much more Republican-leaning; Mitt Romney and Donald Trump won the district by double digits in 2012 and 2016, respectively.
Election results from recent statewide races
| Year | U.S. President | U.S. Senator (Class 1) | U.S. Senator (Class 3) | Governor |
|---|---|---|---|---|
| 1992 | Clinton 46.8–29.2% | Feinstein 57.9–33.8% | Boxer 49.8–39.4% | — |
| 1994 | — | Feinstein 47.9–43.1% | — | Wilson 53.0–41.8% |
| 1996 | Clinton 48.2–35.4% | — | — | — |
| 1998 | — | — | [Data unknown/missing.] | [Data unknown/missing.] |
| 2000 | Gore 50.0–41.0%[5] | Feinstein 53.1–36.0%[6] | — | — |
| 2002 | — | — | — | Davis 46.9–36.3%[7] |
| 2003 | — | — | — | Recall: No 53.0–47.0%[8][9] |
Schwarzenegger 40.8–36.0% | ||||
| 2004 | Kerry 59.7–38.4%[10] | — | Boxer 60.5–34.2%[11] | — |
| 2006 | — | Feinstein 62.7–29.6%[12] | — | Schwarzenegger 51.0–40.9% |
| 2008 | Obama 65.6–31.7%[13] | — | — | — |
| 2010 | — | — | Boxer 59.4–34.6%[14] | Brown 57.0–35.9%[15] |
| 2012 | Romney 56.6–40.3% | Emken 57.5–42.5% | — | — |
| 2014 | — | — | — | Kashkari 56.5–43.5% |
| 2016 | Trump 56.2–36.5% | — | Harris 59.7–40.3% | — |
List of members representing the district
| Representative | Party | Years | Cong ress(es) | Electoral history | Counties |
|---|---|---|---|---|---|
| District created | March 4, 1865 | ||||
 Donald C. McRuer | Republican | March 4, 1865 – March 3, 1867 | 39th | Retired. | Fresno, Inyo, Kern, Los Angeles, Mariposa, Merced, Monterey, San Diego, San Francisco, San Luis Obispo, San Mateo, Santa Barbara, Santa Clara, Santa Cruz, Stanislaus, Tulare |
 Samuel Beach Axtell | Democratic | March 4, 1867 – March 3, 1871 | 40th 41st | Retired. | |
 Sherman Otis Houghton | Republican | March 4, 1871 – March 3, 1873 | 42nd | Redistricted to the 4th district. | |
 Charles Clayton | Republican | March 4, 1873 – March 3, 1875 | 43rd | Retired. | San Francisco |
 William Adam Piper | Democratic | March 4, 1875 – March 3, 1877 | 44th | Lost re-election. | |
 Horace Davis | Republican | March 4, 1877 – March 3, 1881 | 45th 46th | Lost re-election. | |
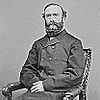
 William Rosecrans | Democratic | March 4, 1881 – March 3, 1885 | 47th 48th | Retired. | |
 Barclay Henley | Democratic | March 4, 1885 – March 3, 1887 | 49th | Redistricted from the 3rd district. | Colusa, Del Norte, Humboldt, Lake, Lassen, Mendocino, Modoc, Napa, Plumas, Shasta, Sierra, Siskiyou, Sonoma, Tehama, Trinity |
 Thomas L. Thompson | Democratic | March 4, 1887 – March 3, 1889 | 50th | Lost re-election. | |
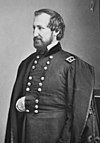
 John J. De Haven | Republican | March 4, 1889 – October 1, 1890 | 51st | Resigned after being appointed associate justice of California Supreme Court. | |
Vacant | October 1, 1890 – December 9, 1890 | ||||
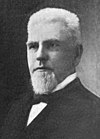
 Thomas J. Geary | Democratic | December 9, 1890 – March 3, 1895 | 51st 52nd 53rd | Elected to finish De Haven's term. Redistricted to the 2nd district. | |
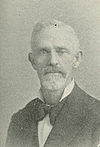 John All Barham | Republican | March 4, 1895 – March 3, 1901 | 54th 55th 56th | Retired. | Del Norte, Humboldt, Lassen, Marin, Mendocino, Modoc, Napa, Plumas, Shasta, Sierra, Siskiyou, Sonoma, Tehama, Trinity |
 Frank Coombs | Republican | March 4, 1901 – March 3, 1903 | 57th | Lost re-election. | |
 James N. Gillett | Republican | March 4, 1903 – November 4, 1906 | 58th 59th | Resigned after being elected Governor. | Alpine, Amador, Calaveras, Del Norte, El Dorado, Humboldt, Lassen, Mariposa, Modoc, Mono, Nevada, Placer, Plumas, Shasta, Sierra, Siskiyou, Tehama, Trinity, Tuolumne |
Vacant | November 4, 1906 – November 6, 1906 | ||||
 William F. Englebright | Republican | November 6, 1906 – March 3, 1911 | 59th 60th 61st | Elected to finish Gillett's term. Lost re-election. | |
 John E. Raker | Democratic | March 4, 1911 – March 3, 1913 | 62nd | Redistricted to the 2nd district. | |
 William Kent | Independent | March 4, 1913 – March 3, 1917 | 63rd 64th | Redistricted from the 2nd district Retired. | Butte, Colusa, Del Norte, Glenn, Humboldt, Lake, Marin, Mendocino, Sonoma, Sutter, Yuba |
 Clarence F. Lea | Democratic | March 4, 1917 – January 3, 1949 | 65th 66th 67th 68th 69th 70th 71st 72nd 73rd 74th 75th 76th 77th 78th 79th 80th | Retired. | |
 Hubert B. Scudder | Republican | January 3, 1949 – January 3, 1953 | 81st 82nd | Retired. | |
| January 3, 1953 – January 3, 1959 | 83rd 84th 85th | Del Norte, Humboldt, Lake, Marin, Mendocino, Napa, Sonoma | |||
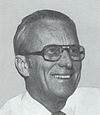
 Clement Woodnutt Miller | Democratic | January 3, 1959 – October 7, 1962 | 86th 87th | Died. | |
Vacant | October 7, 1962 – January 22, 1963 | ||||
 Donald H. Clausen | Republican | January 22, 1963 – January 3, 1967 | 88th 89th | Elected to finish Miller's term. Redistricted to the 2nd district. | Del Norte, Humboldt, Marin, Mendocino, Napa, Sonoma |
| January 3, 1967 – January 3, 1973 | 90th 91st 92nd | Del Norte, Humboldt, most of Marin, Mendocino, Napa, Sonoma | |||
| January 3, 1973 – January 3, 1975 | 93rd | Butte, Glenn, Lassen, Modoc, Nevada, Placer, Plumas, Shasta, Sierra, Siskiyou, Tehama, Trinity, Yuba | |||
 Harold T. Johnson | Democratic | January 3, 1975 – January 3, 1981 | 94th 95th 96th | Redistricted from the 2nd district Lost re-election. | |
 Eugene A. Chappie | Republican | January 3, 1981 – January 3, 1983 | 97th | Redistricted to the 2nd district. | |
 Douglas H. Bosco | Democratic | January 3, 1983 – January 3, 1991 | 98th 99th 100th 101st | Lost re-election. | Del Norte, Humboldt, western Lake, Mendocino, southern Napa, northern Sonoma |
 Frank Riggs | Republican | January 3, 1991 – January 3, 1993 | 102nd | Lost re-election. | |
 Daniel Hamburg | Democratic | January 3, 1993 – January 3, 1995 | 103rd | Lost re-election. | Del Norte, Humboldt, western Lake, Mendocino, Napa, northwestern Solano, northeastern Sonoma |
Frank Riggs | Republican | January 3, 1995 – January 3, 1999 | 104th 105th | Retired to run for U.S. Senator. | |
 Mike Thompson | Democratic | January 3, 1999 – January 3, 2003 | 106th 107th | Elected in 1998. Redistricted to the 5th district. | |
| January 3, 2003 – January 3, 2013 | 108th 109th 110th 111th 112th | 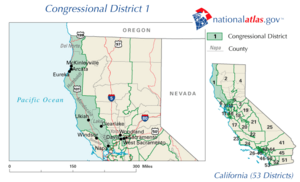 Del Norte, Humboldt, Lake, Mendocino, Napa, eastern Sonoma, southern Yolo | |||
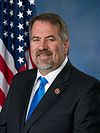 Doug LaMalfa | Republican | January 3, 2013 – present | 113th 114th 115th 116th | Elected in 2012. |  Inland Northern California including Butte, Lassen, Modoc, Plumas, Shasta, Sierra, Siskiyou, and Tehama counties plus portions of Glenn, Nevada, and Placer counties.[4] And including the main hubs of Chico and Redding, in Butte and Shasta Counties respectively. |
Election results
1864 • 1866 • 1868 • 1870 • 1872 • 1874 • 1876 • 1878 • 1880 • 1882 • 1884 • 1886 • 1888 • 1890 (Special) • 1892 • 1894 • 1896 • 1898 • 1900 • 1902 • 1904 • 1906 (Special) • 1908 • 1910 • 1912 • 1914 • 1916 • 1918 • 1920 • 1922 • 1924 • 1926 • 1928 • 1930 • 1932 • 1934 • 1936 • 1938 • 1940 • 1942 • 1944 • 1946 • 1948 • 1950 • 1952 • 1954 • 1956 • 1958 • 1960 • 1962 • 1963 (Special) • 1964 • 1966 • 1968 • 1970 • 1972 • 1974 • 1976 • 1978 • 1980 • 1982 • 1984 • 1986 • 1988 • 1990 • 1992 • 1994 • 1996 • 1998 • 2000 • 2002 • 2004 • 2006 • 2008 • 2012 • 2014 • 2016 • 2018 |
1864
| Party | Candidate | Votes | % | |
|---|---|---|---|---|
Republican | Donald C. McRuer | 20,370 | 58.9 | |
Democratic | Joseph B. Crocker | 14,191 | 41.1 | |
| Total votes | 34,561 | 100.0 | ||
Turnout | ||||
Republican hold | ||||
1866
| Party | Candidate | Votes | % | |||
|---|---|---|---|---|---|---|
Democratic | Samuel Beach Axtell | 18,793 | 57.3 | |||
Republican | Timothy Guy Phelps | 13,989 | 42.7 | |||
| Total votes | 32,782 | 100.0 | ||||
Turnout | ||||||
Democratic gain from Republican | ||||||
1868
| Party | Candidate | Votes | % | |
|---|---|---|---|---|
Democratic | Samuel Beach Axtell (incumbent) | 23,632 | 54.1 | |
Republican | Frank M. Pixley | 20,081 | 45.9 | |
| Total votes | 43,713 | 100.0 | ||
Turnout | ||||
Democratic hold | ||||
1870
| Party | Candidate | Votes | % | |||
|---|---|---|---|---|---|---|
Republican | Sherman Otis Houghton | 25,971 | 51.6 | |||
Democratic | Lawrence Archer | 24,374 | 48.4 | |||
| Total votes | 50,345 | 100.0 | ||||
Turnout | ||||||
Republican gain from Democratic | ||||||
1872
| Party | Candidate | Votes | % | ||
|---|---|---|---|---|---|
Republican | Charles Clayton | 11,938 | 52.3 | ||
Democratic | William Adam Piper | 10,883 | 47.7 | ||
| Total votes | 22,821 | 100.0 | |||
Turnout | |||||
Republican win (new seat) | |||||
1874
| Party | Candidate | Votes | % | |||
|---|---|---|---|---|---|---|
Democratic | William Adam Piper | 12,417 | 49.1 | |||
Republican | Ira P. Rankin | 6,791 | 26.8 | |||
Independent | John F. Swift | 6,103 | 24.1 | |||
| Total votes | 25,311 | 100.0 | ||||
Turnout | ||||||
Democratic gain from Republican | ||||||
1876
| Party | Candidate | Votes | % | |||
|---|---|---|---|---|---|---|
Republican | Horace Davis | 22,134 | 53.3 | |||
Democratic | William Adam Piper (incumbent) | 19,363 | 46.7 | |||
| Total votes | 41,497 | 100.0 | ||||
Turnout | ||||||
Republican gain from Democratic | ||||||
1878
| Party | Candidate | Votes | % | |
|---|---|---|---|---|
Republican | Horace Davis (incumbent) | 20,074 | 48.4 | |
Independent | Clitus Barbour | 18,449 | 44.5 | |
Democratic | Charles R. Summer | 2,940 | 7.1 | |
| Total votes | 41,463 | 100.0 | ||
Turnout | ||||
Republican hold | ||||
1880
| Party | Candidate | Votes | % | |||
|---|---|---|---|---|---|---|
Democratic | William Rosecrans | 21,005 | 51.0 | |||
Republican | Horace Davis (incumbent) | 19,496 | 47.3 | |||
Greenback | Stephen Maybell | 683 | 1.7 | |||
| Total votes | 41,184 | 100.0 | ||||
Turnout | ||||||
Democratic gain from Republican | ||||||
1882
| Party | Candidate | Votes | % | |
|---|---|---|---|---|
Democratic | William Rosecrans (incumbent) | 22,733 | 59.5 | |
Republican | Paul Neumann | 14,847 | 38.8 | |
Prohibition | James M. Shafter | 580 | 1.5 | |
Greenback | H. S. Fitch | 67 | 0.2 | |
| Total votes | 38,227 | 100.0 | ||
Turnout | ||||
Democratic hold | ||||
1884
| Party | Candidate | Votes | % | |
|---|---|---|---|---|
Democratic | Barclay Henley | 16,461 | 49.7 | |
Republican | Thomas L. Carothers | 16,316 | 49.3 | |
Independent | C. C. Bateman [16] | 321 | 1.0 | |
| Total votes | 33,098 | 100.0 | ||
Turnout | ||||
Democratic hold | ||||
1886
| Party | Candidate | Votes | % | |
|---|---|---|---|---|
Democratic | Thomas Larkin Thompson | 16,499 | 50.1 | |
Republican | Charles A. Garter | 15,526 | 47.1 | |
Prohibition | L. W. Simmons | 849 | 2.6 | |
Independent | Philip Cowen | 80 | 0.2 | |
| Total votes | 32,954 | 100.0 | ||
Turnout | ||||
Democratic hold | ||||
1888
| Party | Candidate | Votes | % | |||
|---|---|---|---|---|---|---|
Republican | John J. De Haven | 19,345 | 49.9 | |||
Democratic | Thomas Larkin Thompson (incumbent) | 19,019 | 49.0 | |||
Know Nothing | W. D. Reynolds [17] | 428 | 1.1 | |||
| Total votes | 38,792 | 100.0 | ||||
Turnout | ||||||
Republican gain from Democratic | ||||||
1890 Special & General
| Party | Candidate | Votes | % | |||
|---|---|---|---|---|---|---|
Democratic | Thomas J. Geary | 19,334 | 49.3 | |||
Republican | John All Barham | 19,153 | 48.8 | |||
Prohibition | L. B. Scranton | 759 | 1.9 | |||
| Total votes | 39,246 | 100.0 | ||||
Turnout | ||||||
Democratic gain from Republican | ||||||
1892
| Party | Candidate | Votes | % | |
|---|---|---|---|---|
Democratic | Thomas J. Geary (incumbent) | 19,308 | 56.8 | |
Republican | Edward W. Davis | 13,123 | 38.6 | |
Populist | C. C. Swafford | 1,546 | 4.6 | |
| Total votes | 33,977 | 100.0 | ||
Turnout | ||||
Democratic hold | ||||
1894
| Party | Candidate | Votes | % | |||
|---|---|---|---|---|---|---|
Republican | John All Barham | 15,101 | 41.1 | |||
Democratic | Thomas J. Geary (incumbent) | 13,570 | 37.0 | |||
Populist | Roger F. Grigsby | 7,246 | 19.7 | |||
Prohibition | J. R. Gregory | 790 | 2.2 | |||
| Total votes | 36,707 | 100.0 | ||||
Turnout | ||||||
Republican gain from Democratic | ||||||
1896
| Party | Candidate | Votes | % | |
|---|---|---|---|---|
Republican | John All Barham (incumbent) | 17,826 | 49.7 | |
Democratic | Fletcher A. Cutler | 16,328 | 45.5 | |
Populist | George W. Montieth | 1,497 | 4.2 | |
Prohibition | B. F. Taylor | 249 | 0.7 | |
| Total votes | 35,900 | 100.0 | ||
Turnout | ||||
Republican hold | ||||
1898
| Party | Candidate | Votes | % | |
|---|---|---|---|---|
Republican | John All Barham (incumbent) | 19,598 | 51.8 | |
Democratic | Emmet Seawell | 18,244 | 48.2 | |
| Total votes | 37,842 | 100.0 | ||
Turnout | ||||
Republican hold | ||||
1900
| Party | Candidate | Votes | % | |
|---|---|---|---|---|
Republican | Frank Coombs | 21,227 | 55.3 | |
Democratic | James F. Farraher | 16,270 | 42.4 | |
Social Democrat | William Morgan [18] | 599 | 1.6 | |
Prohibition | Charles T. Clark | 310 | 0.8 | |
| Total votes | 38,406 | 100.0 | ||
Turnout | ||||
Republican hold | ||||
1902
| Party | Candidate | Votes | % | |
|---|---|---|---|---|
Republican | James Gillett | 21,268 | 50.5 | |
Democratic | Anthony Caminetti | 19,696 | 46.7 | |
Socialist | M. F. Shore | 810 | 1.9 | |
Prohibition | W. O. Clark | 362 | 0.9 | |
| Total votes | 42,136 | 100.0 | ||
Turnout | ||||
Republican hold | ||||
1904
| Party | Candidate | Votes | % | |
|---|---|---|---|---|
Republican | James Gillett (incumbent) | 21,602 | 54.1 | |
Democratic | Anthony Caminetti | 15,706 | 39.3 | |
Socialist | A. J. Gaylord | 2,197 | 5.5 | |
Prohibition | Jarrot L. Rollins | 421 | 1.1 | |
| Total votes | 39,926 | 100.0 | ||
Turnout | ||||
Republican hold | ||||
1906 (Special)
| Party | Candidate | Votes | % | |
|---|---|---|---|---|
Republican | William F. Englebright | 18,125 | 95.2 | |
Democratic | F. W. Taft | 539 | 2.8 | |
Socialist | J. C. Weybright | 325 | 1.7 | |
Prohibition | R. L. Webb | 51 | 0.3 | |
| Total votes | 19,040 | 100.0 | ||
Turnout | ||||
Republican hold | ||||
1908
| Party | Candidate | Votes | % | |
|---|---|---|---|---|
Republican | William F. Englebright (incumbent) | 20,624 | 54.1 | |
Democratic | E. W. Holland | 14,031 | 36.8 | |
Socialist | D. N. Cunningham | 2,898 | 7.6 | |
Prohibition | W. P. Fassett | 546 | 1.4 | |
| Total votes | 38,099 | 100.0 | ||
Turnout | ||||
Republican hold | ||||
1910
| Party | Candidate | Votes | % | |||
|---|---|---|---|---|---|---|
Democratic | John E. Raker | 16,704 | 45.4 | |||
Republican | William F. Englebright (incumbent) | 16,570 | 45.1 | |||
Socialist | William Morgan | 3,231 | 8.8 | |||
Prohibition | C. H. Essex | 259 | 0.7 | |||
| Total votes | 37,064 | 100.0 | ||||
Turnout | ||||||
Democratic gain from Republican | ||||||
1912
| Party | Candidate | Votes | % | |||
|---|---|---|---|---|---|---|
Independent | William Kent | 20,341 | 37.3 | |||
Democratic | I. G. Zumwalt | 18,756 | 34.4 | |||
Republican | Edward H. Hart | 10,585 | 19.4 | |||
Socialist | Joseph Bredsteen | 4,892 | 9.0 | |||
| Total votes | 54,574 | 100.0 | ||||
Turnout | ||||||
Independent gain from Democratic | ||||||
1914
| Party | Candidate | Votes | % | |
|---|---|---|---|---|
Independent | William Kent (incumbent) | 35,403 | 48.1 | |
Republican | Edward H. Hart | 28,166 | 38.3 | |
Democratic | O. F. Meldon | 7,987 | 10.8 | |
Prohibition | Henry P. Stipp | 2,068 | 2.8 | |
| Total votes | 73,624 | 100.0 | ||
Turnout | ||||
Independent hold | ||||
1916
| Party | Candidate | Votes | % | |||
|---|---|---|---|---|---|---|
Democratic | Clarence F. Lea | 32,797 | 48.8 | |||
Republican | Edward H. Hart | 28,769 | 42.8 | |||
Socialist | Mary M. Morgan | 3,730 | 5.5 | |||
Prohibition | Jay Scott Ryder | 1,935 | 2.9 | |||
| Total votes | 67,231 | 100.0 | ||||
Turnout | ||||||
Democratic gain from Independent | ||||||
1918
| Party | Candidate | Votes | % | |
|---|---|---|---|---|
Democratic | Clarence F. Lea (incumbent) | 42,063 | 100.0 | |
Turnout | ||||
Democratic hold | ||||
1920
| Party | Candidate | Votes | % | |
|---|---|---|---|---|
Democratic | Clarence F. Lea (incumbent) | 34,427 | 61.7 | |
Republican | C. A. Bodwell, Jr. | 18,569 | 33.3 | |
Socialist | A. K. Gifford | 2,773 | 5.0 | |
| Total votes | 55,769 | 100.0 | ||
Turnout | ||||
Democratic hold | ||||
1922
| Party | Candidate | Votes | % | |
|---|---|---|---|---|
Democratic | Clarence F. Lea (incumbent) | 53,129 | 100.0 | |
Turnout | ||||
Democratic hold | ||||
1924
| Party | Candidate | Votes | % | |
|---|---|---|---|---|
Democratic | Clarence F. Lea (incumbent) | 47,250 | 100.0 | |
Turnout | ||||
Democratic hold | ||||
1926
| Party | Candidate | Votes | % | |
|---|---|---|---|---|
Democratic | Clarence F. Lea (incumbent) | 60,207 | 100.0 | |
Turnout | ||||
Democratic hold | ||||
1928
| Party | Candidate | Votes | % | |
|---|---|---|---|---|
Democratic | Clarence F. Lea (incumbent) | 56,381 | 100.0 | |
Turnout | ||||
Democratic hold | ||||
1930
| Party | Candidate | Votes | % | |
|---|---|---|---|---|
Democratic | Clarence F. Lea (incumbent) | 66,703 | 100.0 | |
Turnout | ||||
Democratic hold | ||||
1932
| Party | Candidate | Votes | % | |
|---|---|---|---|---|
Democratic | Clarence F. Lea (incumbent) | 73,400 | 100.0 | |
Turnout | ||||
Democratic hold | ||||
1934
| Party | Candidate | Votes | % | |
|---|---|---|---|---|
Democratic | Clarence F. Lea (incumbent) | 98,661 | 93.6 | |
Socialist | Allen K. Gifford | 6,698 | 6.4 | |
| Total votes | 105,359 | 100.0 | ||
Turnout | ||||
Democratic hold | ||||
1936
| Party | Candidate | Votes | % | |
|---|---|---|---|---|
Democratic | Clarence F. Lea (incumbent) | 58,073 | 53.8 | |
Republican | Nelson B. Van Matre | 48,647 | 45.1 | |
Communist | Vernon Dennis Healy | 1,218 | 1.1 | |
| Total votes | 107,938 | 100.0 | ||
Turnout | ||||
Democratic hold | ||||
1938
| Party | Candidate | Votes | % | |
|---|---|---|---|---|
Democratic | Clarence F. Lea (incumbent) | 73,636 | 63 | |
Townsend | Ernest S. Mitchell | 43,320 | 37 | |
| Total votes | 116,956 | 100 | ||
Turnout | ||||
Democratic hold | ||||
1940
| Party | Candidate | Votes | % | |
|---|---|---|---|---|
Democratic | Clarence F. Lea (incumbent) | 103,547 | 93.3 | |
Communist | Albert J. Lima | 5,647 | 5.1 | |
Independent | Ernest S. Mitchell (write-in) | 1,828 | 1.6 | |
| Total votes | 111,022 | 100.0 | ||
Turnout | ||||
Democratic hold | ||||
1942
| Party | Candidate | Votes | % | |
|---|---|---|---|---|
Democratic | Clarence F. Lea (incumbent) | 78,281 | 93.2 | |
Communist | Albert J. Lima | 5,703 | 6.8 | |
| Total votes | 83,984 | 100.0 | ||
Turnout | ||||
Democratic hold | ||||
1944
| Party | Candidate | Votes | % | |
|---|---|---|---|---|
Democratic | Clarence F. Lea (incumbent) | 92,706 | 100.0 | |
Turnout | ||||
Democratic hold | ||||
1946
| Party | Candidate | Votes | % | |
|---|---|---|---|---|
Democratic | Clarence F. Lea (incumbent) | 77,653 | 100.0 | |
Turnout | ||||
Democratic hold | ||||
1948
| Party | Candidate | Votes | % | |||
|---|---|---|---|---|---|---|
Republican | Hubert B. Scudder | 82,947 | 54.5 | |||
Democratic | Sterling J. Norgard | 68,951 | 45.3 | |||
Progressive | Roger Kent (write-in) | 304 | 0.2 | |||
| Total votes | 152,302 | 100.0 | ||||
Turnout | ||||||
Republican gain from Democratic | ||||||
1950
| Party | Candidate | Votes | % | |
|---|---|---|---|---|
Republican | Hubert B. Scudder (incumbent) | 85,122 | 54.0 | |
Democratic | Roger Kent | 72,584 | 46.0 | |
| Total votes | 157,706 | 100.0 | ||
Turnout | ||||
Republican hold | ||||
1952
| Party | Candidate | Votes | % | |
|---|---|---|---|---|
Republican | Hubert B. Scudder (incumbent) | 137,801 | 86.4 | |
Progressive | Carl Sullivan | 21,734 | 13.6 | |
| Total votes | 159,535 | 100.0 | ||
Turnout | ||||
Republican hold | ||||
1954
| Party | Candidate | Votes | % | |
|---|---|---|---|---|
Republican | Hubert B. Scudder (incumbent) | 83,762 | 59.1 | |
Democratic | Max Kortum | 58,004 | 40.9 | |
| Total votes | 141,766 | 100.0 | ||
Turnout | ||||
Republican hold | ||||
1956
| Party | Candidate | Votes | % | |
|---|---|---|---|---|
Republican | Hubert B. Scudder (incumbent) | 102,604 | 53.6 | |
Democratic | Clement Woodnutt Miller | 88,962 | 46.4 | |
| Total votes | 191,566 | 100.0 | ||
Turnout | ||||
Republican hold | ||||
1958
| Party | Candidate | Votes | % | |||
|---|---|---|---|---|---|---|
Democratic | Clement Woodnutt Miller | 102,096 | 54.9 | |||
Republican | Frederick G. Dupuis | 84,807 | 45.1 | |||
| Total votes | 185,903 | 100.0 | ||||
Turnout | ||||||
Democratic gain from Republican | ||||||
1960
| Party | Candidate | Votes | % | |
|---|---|---|---|---|
Democratic | Clement Woodnutt Miller (incumbent) | 115,829 | 51.6 | |
Republican | Frederick G. Dupuis | 108,505 | 48.4 | |
| Total votes | 224,334 | 100.0 | ||
Turnout | ||||
Democratic hold | ||||
1962
| Party | Candidate | Votes | % | |
|---|---|---|---|---|
Democratic | Clement Woodnutt Miller (incumbent) | 100,962 | 50.8 | |
Republican | Donald H. Clausen | 97,949 | 49.2 | |
| Total votes | 198,911 | 100.0 | ||
Turnout | ||||
Democratic hold | ||||
1963 (Special)
| Party | Candidate | Votes | % | |||
|---|---|---|---|---|---|---|
Republican | Don H. Clausen | 54.2 | ||||
Democratic | William F. Grader | 44.7 | ||||
Democratic | John C. Stuart (write-in) | 1.1 | ||||
| Total votes | 100.0 | |||||
Turnout | ||||||
Republican gain from Democratic | ||||||
1964
| Party | Candidate | Votes | % | |
|---|---|---|---|---|
Republican | Donald H. Clausen (incumbent) | 141,048 | 59.1 | |
Democratic | George McCabe | 97,651 | 40.9 | |
| Total votes | 238,699 | 100.0 | ||
Turnout | ||||
Republican hold | ||||
1966
| Party | Candidate | Votes | % | |
|---|---|---|---|---|
Republican | Donald H. Clausen (incumbent) | 143,755 | 65.1 | |
Democratic | Thomas T. Storer | 77,000 | 34.9 | |
| Total votes | 220,755 | 100.0 | ||
Turnout | ||||
Republican hold | ||||
1968
| Party | Candidate | Votes | % | |
|---|---|---|---|---|
Republican | Donald H. Clausen (incumbent) | 132,433 | 75.1 | |
Democratic | Donald W. Graham | 37,650 | 21.4 | |
Peace and Freedom | Adolph N. Hofmann | 3,372 | 1.9 | |
American Independent | Gladys O'Neil | 2,882 | 1.6 | |
| Total votes | 176,337 | 100.0 | ||
Turnout | ||||
Republican hold | ||||
1970
| Party | Candidate | Votes | % | |
|---|---|---|---|---|
Republican | Donald H. Clausen (incumbent) | 108,358 | 63.5 | |
Democratic | William Kortum | 62,688 | 36.5 | |
| Total votes | 171,046 | 100.0 | ||
Turnout | ||||
Republican hold | ||||
1972
| Party | Candidate | Votes | % | |
|---|---|---|---|---|
Republican | Donald H. Clausen (incumbent) | 140,807 | 62.2 | |
Democratic | William A. Nighswonger | 77,138 | 34.1 | |
Peace and Freedom | Jonathan T. Ames | 8,470 | 3.7 | |
| Total votes | 226,145 | 100.0 | ||
Turnout | ||||
Republican hold | ||||
1974
| Party | Candidate | Votes | % | |
|---|---|---|---|---|
Democratic | Harold T. Johnson (incumbent) | 137,849 | 85.8 | |
American Independent | Dorothy D. Paradis | 22,628 | 14.2 | |
| Total votes | 160,477 | 100.0 | ||
Turnout | ||||
Democratic hold | ||||
1976
| Party | Candidate | Votes | % | |
|---|---|---|---|---|
Democratic | Harold T. Johnson (incumbent) | 160,477 | 73.9% | |
Republican | James E. Taylor | 56,539 | 26.1% | |
| Total votes | 217,016 | 100.0% | ||
Democratic hold | ||||
1978
| Party | Candidate | Votes | % | |
|---|---|---|---|---|
Democratic | Harold T. Johnson (inc.) | 125,122 | 59.4 | |
Republican | James E. Taylor | 85,690 | 40.6 | |
| Total votes | 210,812 | 100.0 | ||
Turnout | ||||
Democratic hold | ||||
1980
| Party | Candidate | Votes | % | |||
|---|---|---|---|---|---|---|
Republican | Eugene A. Chappie | 145,098 | 53.7 | |||
Democratic | Harold T. Johnson (incumbent) | 107,682 | 39.8 | |||
Libertarian | Jim McClarin | 17,419 | 6.5 | |||
| Total votes | 270,199 | 100.0 | ||||
Turnout | ||||||
Republican gain from Democratic | ||||||
1982
| Party | Candidate | Votes | % | |||
|---|---|---|---|---|---|---|
Democratic | Douglas H. Bosco | 107,749 | 49.8 | |||
Republican | Donald H. Clausen (incumbent) | 102,043 | 47.2 | |||
Libertarian | David Redick | 6,374 | 2.9 | |||
| Total votes | 216,166 | 100.0 | ||||
Turnout | ||||||
Democratic gain from Republican | ||||||
1984
| Party | Candidate | Votes | % | |
|---|---|---|---|---|
Democratic | Douglas H. Bosco (incumbent) | 157,037 | 62.3 | |
Republican | Floyd G. Sampson | 95,186 | 37.7 | |
| Total votes | 252,223 | 100.0 | ||
Turnout | ||||
Democratic hold | ||||
1986
| Party | Candidate | Votes | % | |
|---|---|---|---|---|
Democratic | Douglas H. Bosco (incumbent) | 138,174 | 67.5 | |
Republican | Floyd G. Sampson | 54,436 | 26.6 | |
Peace and Freedom | Elden McFarland | 12,149 | 5.9 | |
| Total votes | 204,759 | 100.0 | ||
Turnout | ||||
Democratic hold | ||||
1988
| Party | Candidate | Votes | % | |
|---|---|---|---|---|
Democratic | Douglas H. Bosco (incumbent) | 159,815 | 62.9 | |
Republican | Samuel "Mark" Vanderbilt | 72,189 | 28.4 | |
Peace and Freedom | Eric Fried | 22,150 | 8.7 | |
| Total votes | 254,154 | 100.0 | ||
Turnout | ||||
Democratic hold | ||||
1990
| Party | Candidate | Votes | % | |||
|---|---|---|---|---|---|---|
Republican | Frank Riggs | 99,782 | 43.3 | |||
Democratic | Douglas H. Bosco (incumbent) | 96,468 | 41.9 | |||
Peace and Freedom | Darlene G. Comingore | 34,011 | 14.8 | |||
| Total votes | 230,261 | 100.0 | ||||
Turnout | ||||||
Republican gain from Democratic | ||||||
1992
| Party | Candidate | Votes | % | |||
|---|---|---|---|---|---|---|
Democratic | Dan Hamburg | 119,676 | 47.6 | |||
Republican | Frank Riggs (incumbent) | 113,266 | 45.1 | |||
Peace and Freedom | Phil Baldwin | 10,764 | 4.3 | |||
Libertarian | Matthew L. Howard | 7,500 | 3.0 | |||
| Total votes | 251,206 | 100.0 | ||||
Turnout | ||||||
Democratic gain from Republican | ||||||
1994
| Party | Candidate | Votes | % | |||
|---|---|---|---|---|---|---|
Republican | Frank Riggs | 106,870 | 53.3 | |||
Democratic | Dan Hamburg (incumbent) | 93,717 | 46.7 | |||
No party | Chase (write-in) | 86 | 0.0% | |||
| Total votes | 200,673 | 100.0 | ||||
Turnout | ||||||
Republican gain from Democratic | ||||||
1996
| Party | Candidate | Votes | % | |
|---|---|---|---|---|
Republican | Frank Riggs (incumbent) | 110,242 | 49.7 | |
Democratic | Michela Alioto | 96,522 | 43.4 | |
Libertarian | Emil Rossi | 15,354 | 6.9 | |
| Total votes | 222,118 | 100.0 | ||
Turnout | ||||
Republican hold | ||||
1998
| Party | Candidate | Votes | % | |||
|---|---|---|---|---|---|---|
Democratic | Mike Thompson | 121,713 | 61.9 | |||
Republican | Mark Luce | 64,622 | 32.8 | |||
Libertarian | Emil Rossi | 5,404 | 2.8 | |||
Peace and Freedom | Ernest K. Jones, Jr. | 4,996 | 2.5 | |||
Republican | Lawrence R. Weisner (write-in) | 37 | 0.0 | |||
| Total votes | 196,772 | 100.0 | ||||
Turnout | ||||||
Democratic gain from Republican | ||||||
2000
| Party | Candidate | Votes | % | |
|---|---|---|---|---|
Democratic | Mike Thompson (incumbent) | 155,638 | 65.1 | |
Republican | Russel J. "Jim" Chase | 66,987 | 28.0 | |
Natural Law | Cheryl Kreier | 7,173 | 3.0 | |
Libertarian | Emil P. Rossi | 6,376 | 2.6 | |
Reform | Pamela Elizondo | 3,161 | 1.3 | |
| Total votes | 239,335 | 100.0 | ||
Turnout | ||||
Democratic hold | ||||
2002
| Party | Candidate | Votes | % | |
|---|---|---|---|---|
Democratic | Mike Thompson (incumbent) | 118,669 | 64.1 | |
Republican | Lawrence R. Wiesner | 60,013 | 32.4 | |
Libertarian | Kevin Bastian | 6,534 | 3.5 | |
| Total votes | 185,216 | 100.0 | ||
Turnout | ||||
Democratic hold | ||||
2004
| Party | Candidate | Votes | % | |
|---|---|---|---|---|
Democratic | Mike Thompson (incumbent) | 189,336 | 67.0 | |
Republican | Lawrence R. Wiesner | 79,970 | 28.2 | |
Green | Pamela Elizondo | 13,635 | 4.8 | |
| Total votes | 282,941 | 100.0 | ||
Turnout | ||||
Democratic hold | ||||
2006
| Party | Candidate | Votes | % | |
|---|---|---|---|---|
Democratic | Mike Thompson (incumbent) | 144,409 | 66.3 | |
Republican | John W. Jones | 63,194 | 29.0 | |
Green | Pamela Elizondo | 6,899 | 3.1 | |
Peace and Freedom | Timothy J. Stock | 3,503 | 1.6 | |
| Total votes | 218,044 | 100.0 | ||
Turnout | ||||
Democratic hold | ||||
2008
| Party | Candidate | Votes | % | |
|---|---|---|---|---|
Democratic | Mike Thompson (incumbent) | 154,006 | 68.2 | |
Republican | Zane Starkewolf | 53,561 | 23.7 | |
Green | Carol Wolman | 18,492 | 8.1 | |
| Total votes | 226,059 | 100.00 | ||
Turnout | ||||
Democratic hold | ||||
2010
| Party | Candidate | Votes | % | |
|---|---|---|---|---|
Democratic | Mike Thompson (incumbent) | 136,605 | 63% | |
Republican | Loren Hanks | 67,217 | 31% | |
Green | Carol Wolman | 7,576 | 3% | |
Libertarian | Mike Rodrigues | 5,484 | 3% | |
| Total votes | 216,882 | 100% | ||
Turnout | ||||
Democratic hold | ||||
2012
| Party | Candidate | Votes | % | |
|---|---|---|---|---|
Republican | Doug LaMalfa | 168,827 | 57.4% | |
Democratic | Jim Reed | 125,386 | 42.6% | |
| Total votes | 294,213 | 100.0% | ||
Republican hold | ||||
2014
| Party | Candidate | Votes | % | |
|---|---|---|---|---|
Republican | Doug LaMalfa (incumbent) | 132,052 | 61.0% | |
Democratic | Heidi Hall | 84,320 | 39.0% | |
| Total votes | 216,372 | 100.0% | ||
Republican hold | ||||
2016
| Party | Candidate | Votes | % | |
|---|---|---|---|---|
Republican | Doug LaMalfa (incumbent) | 185,448 | 59.1% | |
Democratic | Jim Reed | 128,588 | 40.9% | |
| Total votes | 314,036 | 100.0% | ||
Republican hold | ||||
2018
| Party | Candidate | Votes | % | |
|---|---|---|---|---|
Republican | Doug LaMalfa (incumbent) | 160,046 | 54.9% | |
Democratic | Audrey Denney | 131,548 | 45.1% | |
| Total votes | 291,594 | 100.0% | ||
Republican hold | ||||
Living former representatives
As of April 2015[update], there are four former members of the U.S. House of Representatives from California's 1st congressional district that are currently living. The most recent representative to die was Donald H. Clausen (1963–1975) on February 7, 2015. the most recently serving representative to die was Eugene A. Chappie (1981–1983) on May 31, 1992.
| Representative | Term in office | Date of birth (and age) |
|---|---|---|
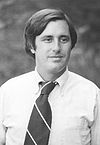
Douglas H. Bosco | 1983–1991 | (1946-07-28) July 28, 1946 |
Frank Riggs | 1991–1993 1995–1999 | (1950-09-05) September 5, 1950 |
Daniel Hamburg | 1993–1995 | (1948-10-06) October 6, 1948 |
Mike Thompson | 1999–2013 | (1951-01-24) January 24, 1951 |
Historical district boundaries
2003 - 2013
See also
- List of United States congressional districts
- California's congressional districts
References
^ https://www.census.gov/mycd/?st=06&cd=01
^ "California election results - 2012 election". Los Angeles Times. November 6, 2012. Archived from the original on February 5, 2013. Retrieved February 24, 2013..mw-parser-output cite.citationfont-style:inherit.mw-parser-output qquotes:"""""""'""'".mw-parser-output code.cs1-codecolor:inherit;background:inherit;border:inherit;padding:inherit.mw-parser-output .cs1-lock-free abackground:url("//upload.wikimedia.org/wikipedia/commons/thumb/6/65/Lock-green.svg/9px-Lock-green.svg.png")no-repeat;background-position:right .1em center.mw-parser-output .cs1-lock-limited a,.mw-parser-output .cs1-lock-registration abackground:url("//upload.wikimedia.org/wikipedia/commons/thumb/d/d6/Lock-gray-alt-2.svg/9px-Lock-gray-alt-2.svg.png")no-repeat;background-position:right .1em center.mw-parser-output .cs1-lock-subscription abackground:url("//upload.wikimedia.org/wikipedia/commons/thumb/a/aa/Lock-red-alt-2.svg/9px-Lock-red-alt-2.svg.png")no-repeat;background-position:right .1em center.mw-parser-output .cs1-subscription,.mw-parser-output .cs1-registrationcolor:#555.mw-parser-output .cs1-subscription span,.mw-parser-output .cs1-registration spanborder-bottom:1px dotted;cursor:help.mw-parser-output .cs1-hidden-errordisplay:none;font-size:100%.mw-parser-output .cs1-visible-errorfont-size:100%.mw-parser-output .cs1-subscription,.mw-parser-output .cs1-registration,.mw-parser-output .cs1-formatfont-size:95%.mw-parser-output .cs1-kern-left,.mw-parser-output .cs1-kern-wl-leftpadding-left:0.2em.mw-parser-output .cs1-kern-right,.mw-parser-output .cs1-kern-wl-rightpadding-right:0.2em
^ "Partisan Voting Index – Districts of the 115th Congress" (PDF). The Cook Political Report. April 7, 2017. Archived (PDF) from the original on June 7, 2017. Retrieved April 7, 2017.
^ ab "Maps: Final Congressional Districts". Citizens Redistricting Commission. Archived from the original on 2013-03-10. Retrieved February 24, 2013.
^ Statement of Vote (2000 President) Archived May 20, 2011, at the Wayback Machine.
^ Statement of Vote (2000 Senator) Archived May 20, 2011, at the Wayback Machine.
^ Statement of Vote (2002 Governor) Archived November 11, 2010, at the Wayback Machine.
^ Statement of Vote (2003 Recall Question) Archived May 20, 2011, at the Wayback Machine.
^ Statement of Vote (2003 Governor) Archived May 20, 2011, at the Wayback Machine.
^ Statement of Vote (2004 President) Archived May 20, 2011, at the Wayback Machine.
^ Statement of Vote (2004 Senator) Archived August 10, 2011, at the Wayback Machine.
^ Statement of Vote (2006 Senator) Archived August 10, 2011, at the Wayback Machine.
^ California Secretary of State. Supplement to the Statement of Vote. President. Counties by Congressional District. Archived August 16, 2012, at the Wayback Machine.
^ Statement of Vote (2010 Governor Archived 2011-05-20 at the Wayback Machine.
^ Statement of Vote (2010 Governor) Archived 2011-05-20 at the Wayback Machine.
^ "JoinCalifornia - C. C. Bateman". www.joincalifornia.com. Archived from the original on 5 April 2016. Retrieved 4 May 2018.
^ "JoinCalifornia - W. D. Reynolds". www.joincalifornia.com. Archived from the original on 3 March 2016. Retrieved 4 May 2018.
^ "JoinCalifornia - William Morgan". www.joincalifornia.com. Archived from the original on 4 April 2016. Retrieved 4 May 2018.
^ "1920 general election results" (PDF). house.gov. Archived (PDF) from the original on 29 December 2011. Retrieved 4 May 2018.
^ "1922 general election results" (PDF). house.gov. Archived (PDF) from the original on 9 July 2014. Retrieved 4 May 2018.
^ "1924 general election results" (PDF). house.gov. Archived (PDF) from the original on 7 June 2016. Retrieved 4 May 2018.
^ "1926 general election results" (PDF). house.gov. Archived (PDF) from the original on 8 June 2016. Retrieved 4 May 2018.
^ "1928 general election results" (PDF). house.gov. Archived (PDF) from the original on 25 May 2017. Retrieved 4 May 2018.
^ "1930 general election results" (PDF). house.gov. Archived (PDF) from the original on 23 April 2012. Retrieved 4 May 2018.
^ "1932 general election results" (PDF). house.gov. Archived (PDF) from the original on 17 August 2008. Retrieved 4 May 2018.
^ "1934 general election results" (PDF). house.gov. Archived (PDF) from the original on 18 August 2008. Retrieved 4 May 2018.
^ "1936 general election results" (PDF). house.gov. Archived (PDF) from the original on 20 August 2008. Retrieved 4 May 2018.
^ "1938 general election results" (PDF). house.gov. Archived (PDF) from the original on 19 August 2008. Retrieved 4 May 2018.
^ "1940 general election results" (PDF). house.gov. Archived (PDF) from the original on 5 January 2007. Retrieved 4 May 2018.
^ "1942 general election results" (PDF). house.gov. Archived (PDF) from the original on 22 August 2008. Retrieved 4 May 2018.
^ "1944 general election results" (PDF). house.gov. Archived (PDF) from the original on 9 July 2014. Retrieved 4 May 2018.
^ "1946 general election results" (PDF). house.gov. Archived (PDF) from the original on 10 May 2013. Retrieved 4 May 2018.
^ "1948 general election results" (PDF). house.gov. Archived (PDF) from the original on 28 June 2011. Retrieved 4 May 2018.
^ "1950 general election results" (PDF). house.gov. Archived (PDF) from the original on 29 October 2013. Retrieved 4 May 2018.
^ "1952 general election results" (PDF). house.gov. Archived (PDF) from the original on 29 December 2011. Retrieved 4 May 2018.
^ "1954 general election results" (PDF). house.gov. Archived (PDF) from the original on 29 December 2011. Retrieved 4 May 2018.
^ "1956 general election results" (PDF). house.gov. Archived (PDF) from the original on 6 November 2011. Retrieved 4 May 2018.
^ "1958 general election results" (PDF). house.gov. Archived (PDF) from the original on 5 January 2007. Retrieved 4 May 2018.
^ "1960 general election results" (PDF). house.gov. Archived (PDF) from the original on 6 November 2011. Retrieved 4 May 2018.
^ "1962 general election results" (PDF). house.gov. Archived (PDF) from the original on 3 August 2010. Retrieved 4 May 2018.
^ "JoinCalifornia - 01-22-1963 Election". www.joincalifornia.com. Archived from the original on 7 April 2016. Retrieved 4 May 2018.
^ "1964 general election results" (PDF). house.gov. Archived (PDF) from the original on 26 July 2011. Retrieved 4 May 2018.
^ "1966 general election results" (PDF). house.gov. Archived (PDF) from the original on 6 November 2011. Retrieved 4 May 2018.
^ "1968 general election results" (PDF). house.gov. Archived (PDF) from the original on 20 September 2011. Retrieved 4 May 2018.
^ "1970 general election results" (PDF). house.gov. Archived (PDF) from the original on 7 December 2014. Retrieved 4 May 2018.
^ "1972 general election results" (PDF). house.gov. Archived (PDF) from the original on 14 August 2011. Retrieved 4 May 2018.
^ "1974 general election results" (PDF). house.gov. Archived (PDF) from the original on 27 October 2011. Retrieved 4 May 2018.
^ MIT Election Data and Science Lab, 2017, "U.S. House 1976–2016", https://doi.org/10.7910/DVN/IG0UN2, Harvard Dataverse, V2, UNF:6:MQvi4Q/ZlkeOLdzzs5nnyg== [fileUNF]
^ "1978 general election results" (PDF). house.gov. Archived (PDF) from the original on 28 September 2011. Retrieved 4 May 2018.
^ "1980 general election results" (PDF). house.gov. Archived (PDF) from the original on 23 January 2017. Retrieved 4 May 2018.
^ "1982 general election results" (PDF). house.gov. Archived (PDF) from the original on 14 August 2011. Retrieved 4 May 2018.
^ "1984 general election results" (PDF). house.gov. Archived (PDF) from the original on 27 October 2011. Retrieved 4 May 2018.
^ "1986 general election results" (PDF). house.gov. Archived (PDF) from the original on 23 January 2017. Retrieved 4 May 2018.
^ "1988 general election results" (PDF). house.gov. Archived (PDF) from the original on 1 July 2011. Retrieved 4 May 2018.
^ "1990 general election results" (PDF). house.gov. Archived (PDF) from the original on 16 July 2011. Retrieved 4 May 2018.
^ 1992 general election results Archived 2017-01-23 at the Wayback Machine.
^ "1994 general election results" (PDF). house.gov. Archived (PDF) from the original on 25 May 2017. Retrieved 4 May 2018.
^ "1996 general election results" (PDF). house.gov. Archived (PDF) from the original on 25 May 2017. Retrieved 4 May 2018.
^ "1998 general election results" (PDF). house.gov. Archived (PDF) from the original on 23 January 2017. Retrieved 4 May 2018.
^ "2000 general election results" (PDF). house.gov. Archived (PDF) from the original on 25 May 2017. Retrieved 4 May 2018.
^ 2002 general election results Archived February 3, 2009, at the Wayback Machine.
^ 2004 general election results Archived August 21, 2008, at the Wayback Machine.
^ 2006 general election results Archived November 27, 2008, at the Wayback Machine.
^ 2008 general election results
^ "2010 general election results - United States Representative" (PDF). ca.gov. Archived (PDF) from the original on 28 January 2017. Retrieved 4 May 2018.
^ https://elections.cdn.sos.ca.gov/sov/2012-general/06-sov-summary.xls
^ https://elections.cdn.sos.ca.gov/sov/2014-general/xls/06-summary.xls
^ https://elections.cdn.sos.ca.gov/sov/2016-general/sov/csv-candidates.xls
^ 2018 general election results
External links
- GovTrack.us: California's 1st congressional district
RAND California Election Returns: District Definitions (out of date)
California Voter Foundation map - CD01 (out of date)
Coordinates: 40°42′N 121°24′W / 40.7°N 121.4°W / 40.7; -121.4


